

Crown Joule
Our first cut analysis of the 2026 Statistical Review of World Energy.

“For a successful technology, reality must take precedence over public relations, for nature cannot be fooled.” – Richard Feynman
The Arab oil embargo of the 1970’s caused the first panic over energy security in the U.S., long before CO2, greenhouse gas (GHG) emissions, and “climate change” were policy priorities. In 1979, President Jimmy Carter held a dedication ceremony celebrating the installation of 32 solar photovoltaic panels on the roof of the West Wing of the White House.
A Wikipedia entry about the event notes that (emphasis added):
“The panels provided almost 75 percent of the energy to heat 1,000 gallons of water in the staff kitchen of the White House.”
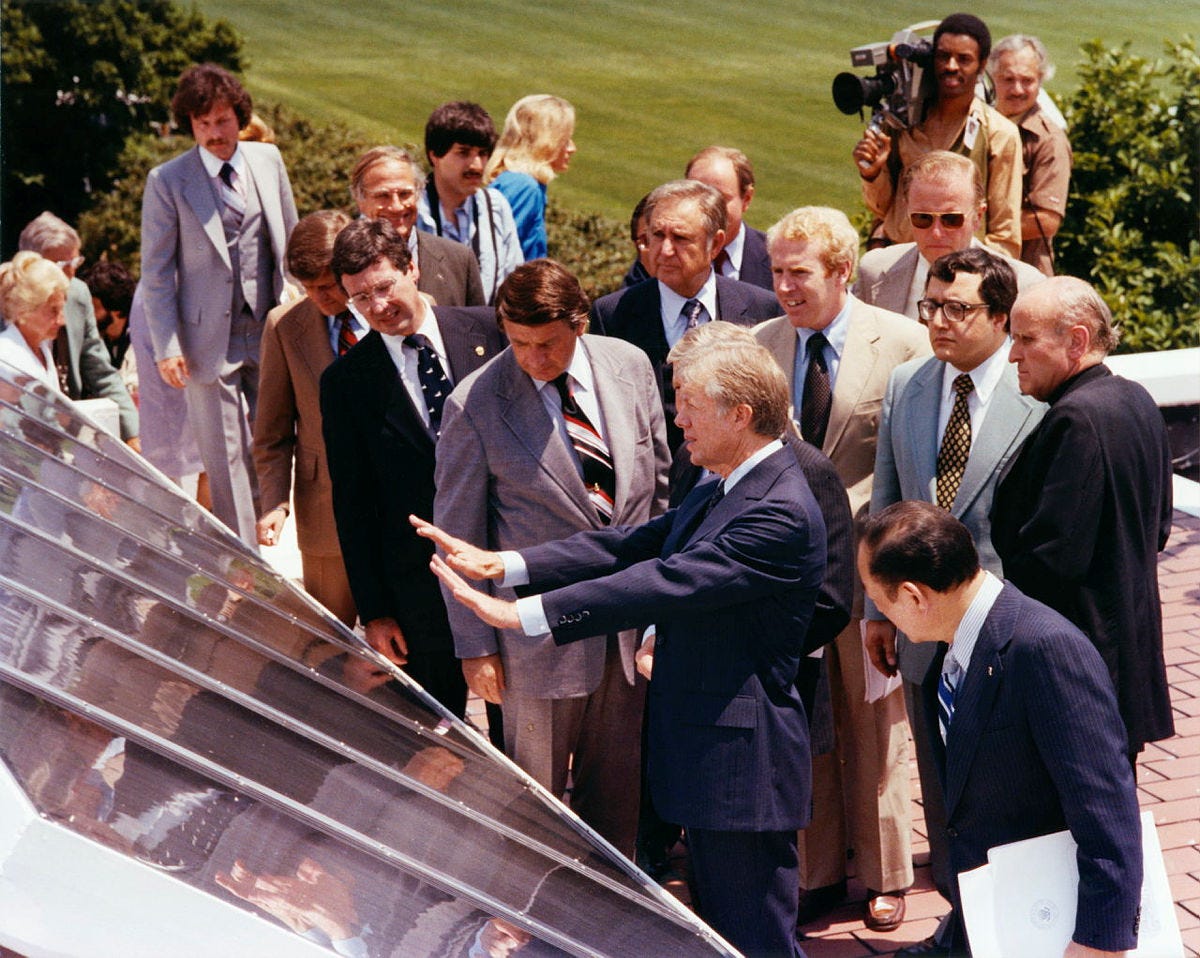
Carter set an ambitious goal that year, striving for America to generate 20 percent of the nation’s energy needs by the year 2000 from “renewable” energy sources. That, obviously, did not happen.
U.S. crude oil production did drop to 6.8 million barrels per day (bpd) in 2008. But the American energy industry was on the verge of unlocking the nation’s vast shale reserves, and technical innovations in hydraulic fracturing, horizontal drilling, and 3D seismic imaging unleased a new oil boom. By the end of 2025, American oil producers were pulling over 21 million bpd out of the ground, more than 3 times U.S. production in 2008.
President Regan took down Carter’s panels in the 1980s. In 2003, George H. Bush reinstalled solar thermal heaters. The Obama administration put more solar panels back up on the White House roof in 2013. All of these were merely symbolic displays.

For nearly 50 years, we’ve been told that nuclear fusion was only a few years away, and once achieved, the power therefrom would be almost too cheap to meter. A few startups and Department of Energy projects have actually achieved a small net power gain in fusion reactors, but getting to commercial scale is not going to happen any time soon.
Gargantuan supplies of carbon-free energy sources at scale and cost parity with hydrocarbons are always right around the corner. But according to the latest update to the world’s most complete energy data set, it’s hard to find that the incremental gains taking place are any form of energy “transition,” or that any real “net zero” CO2 and GHG emissions scenario is anywhere on the horizon.
On June 30th, the Energy Institute released the 2026 update to the Statistical Review of World Energy (2026 Review). The annual compendium captures the world’s energy production and consumption, and its release is eagerly anticipated by those who follow the flow of electrons and molecules closely. How much progress did the world make towards the much hyped “renewable energy transition” in 2025? How dependent is the world still on the form of energy so magical that if we hadn’t discovered it, we would have had to invent it? And how do the U.S. and China actually compare despite the latter being held out as the world’s leader in “renewable” energy?
It will take us some time to tease out additional insights, and to give them context and relevance to geopolitical disruptions as they occur, economic oscillations, proposed changes in domestic political policies, and other events. The 2026 Review is a big, multi-layered onion. But upon peeling back the first layer, we wanted to share our initial findings with readers.
We begin with the Energy Institute’s (EI) teleconference for the release. The event included a thirty-three-page PowerPoint deck summarizing the 2026 Review. The opening slides describe EI’s history (a charity granted by Royal Charter dating to 1914 in the UK) and function. The sixth slide summarizes EI’s triple role.

In the third of those roles, EI might reconsider the messaging, especially as respects the developing world. Everyone wants energy to be safer, more efficient and affordable. Most likely would prefer it to be lower carbon as well.
Lower carbon is a clearly articulated objective of EI’s third role. Affordability is not.
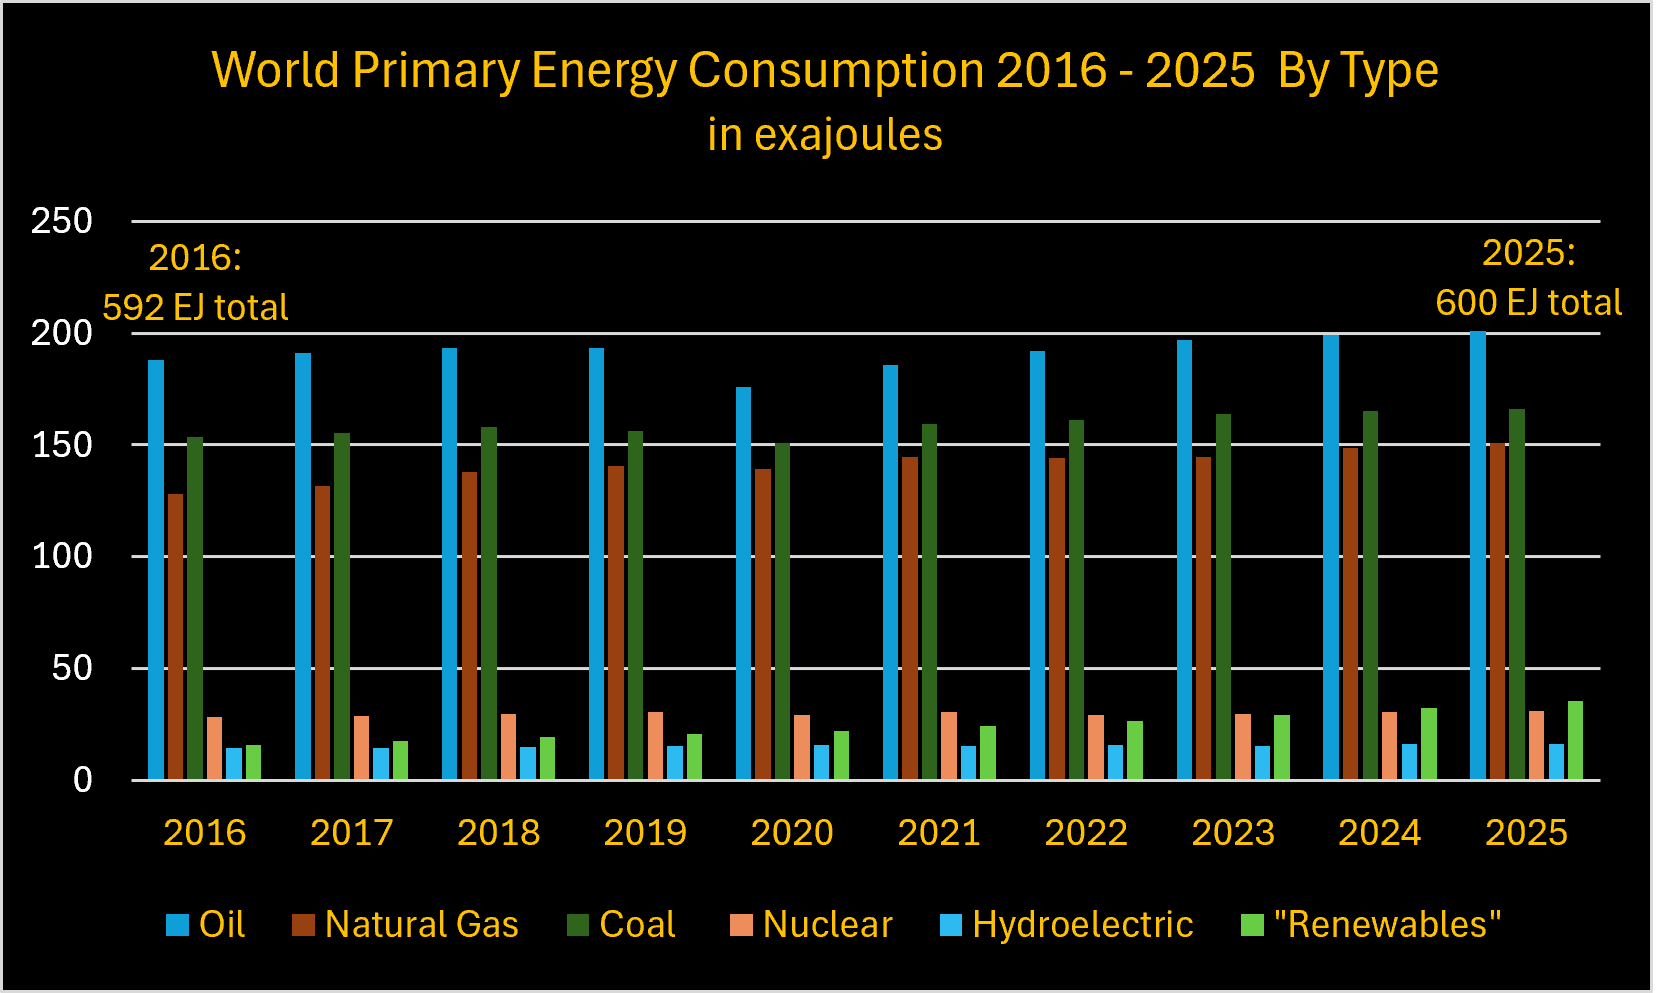
For the second year in a row, all forms of energy – oil, natural gas, coal (hydrocarbons), nuclear, hydroelectric and “renewables” – increased globally. For the world, total energy consumption increased from 592 exajoules (EJ) to 600 EJ.
As a refresher, 1 EJ contains the energy equivalent of ~174 million barrels of oil. So, the increase of 8 EJ represents the energy equivalent of just under 1.4 billion barrels of oil.
“Renewables” gained the most in 2025. The combination of wind, solar, biomass, biofuels and geothermal gained 10% (3.2 EJ).
Nuclear energy gained one-third of an EJ. Another 80 gigawatts (GWs), eventually good for about another 2.5 EJ, is currently under construction worldwide, about half of it in China.
Hydroelectric was essentially flat. Globally, something on the order of 130 – 260 GWs of hydroelectric, a large share of which includes pumped storage, is presently under construction.
Climate and “renewable” energy advocates are happy to point that “carbon-free” sources reached almost 14% of world primary energy consumption in 2025. That figure lumps nuclear and hydroelectric in with “renewables” (wind, solar, biomass, geothermal). Here we point out that because “environmentalists” have fought nuclear and hydroelectric at every turn for more than a quarter century, their attempting to count nuclear and hydroelectric in the “clean” energy bucket for optics is a ruse we will not permit.
“Renewables” on their own still only represent a paltry 6% of world primary energy consumption, up from 3% in 2016, the year Paris Agreement was signed. (For that reason, we use 2016 in most of the graphs that follow since it is the “baseline” year for the “landmark” global climate agreement. The U.S. is presently not a participant to the agreement, having now twice withdrawn during Trump’s two terms as President).
“Renewables” fare much better when it comes to percentage of electricity generation. In 2025, they accounted for their highest share of global electricity consumption ever, with their 6,270 terawatt hours (Twh) accounting for 19% of the world’s 32,202 Twh of electricity consumed.
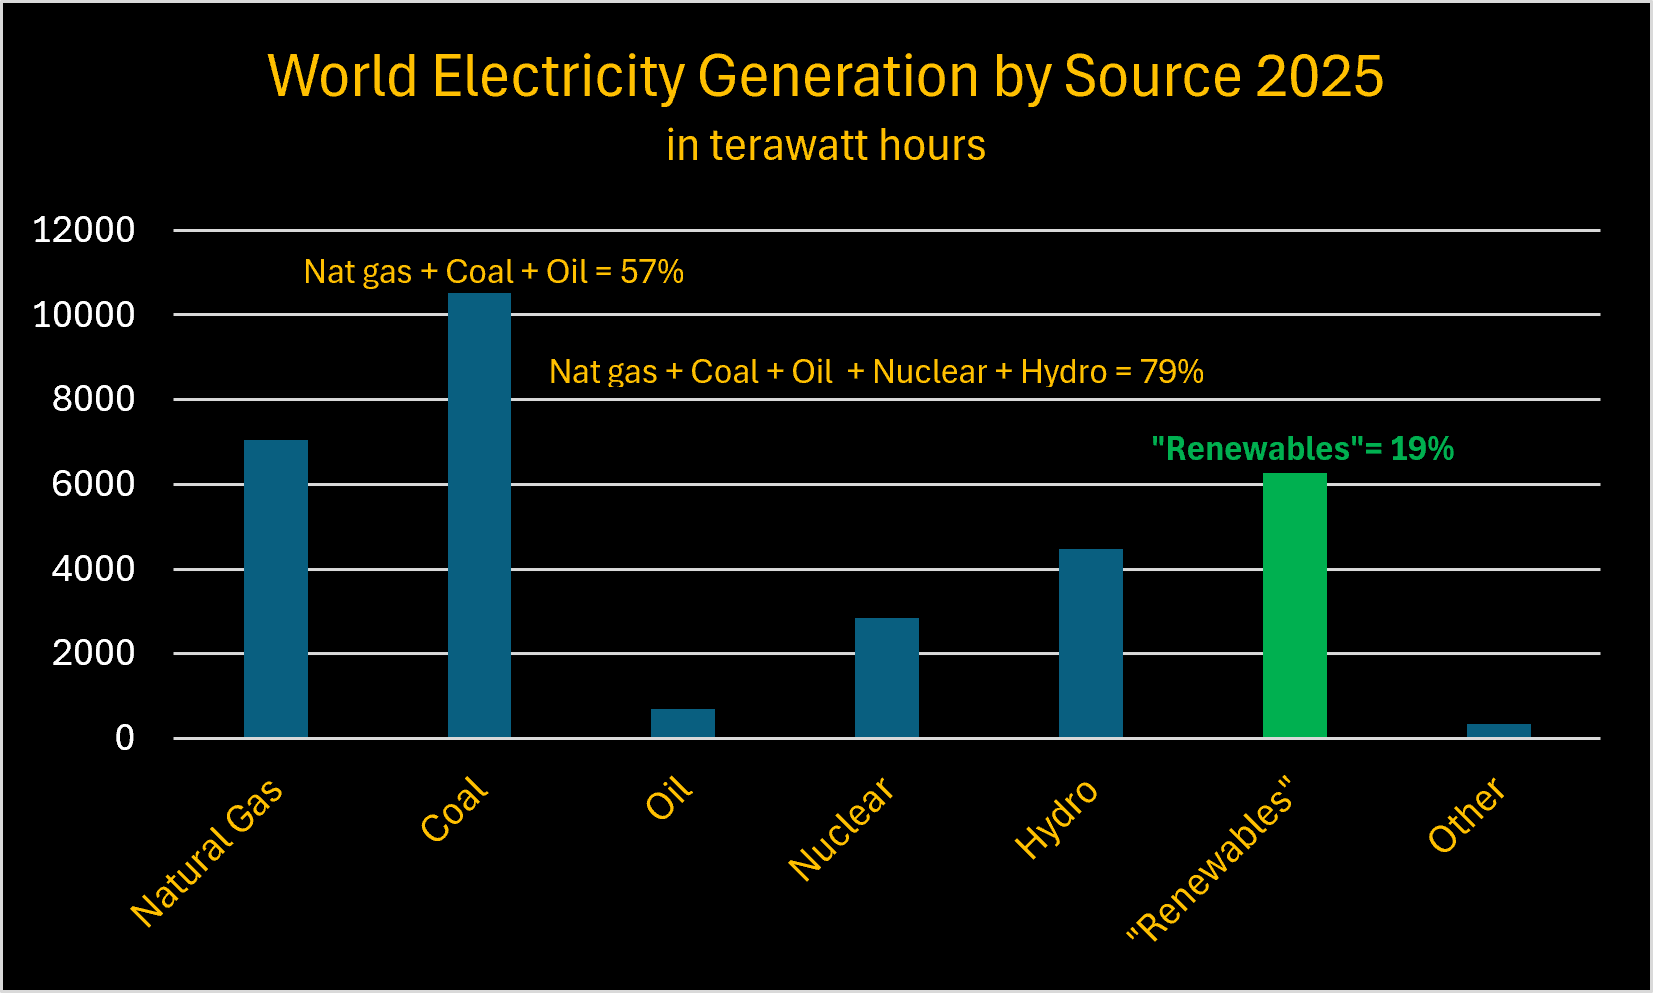
But electricity only accounts for about 21% of the world’s primary energy consumption. It is clear from the first of the two graphs above what is still doing the world’s heavy lifting. But just to put a bow around it, the graph below shows the specific figures for 2025:
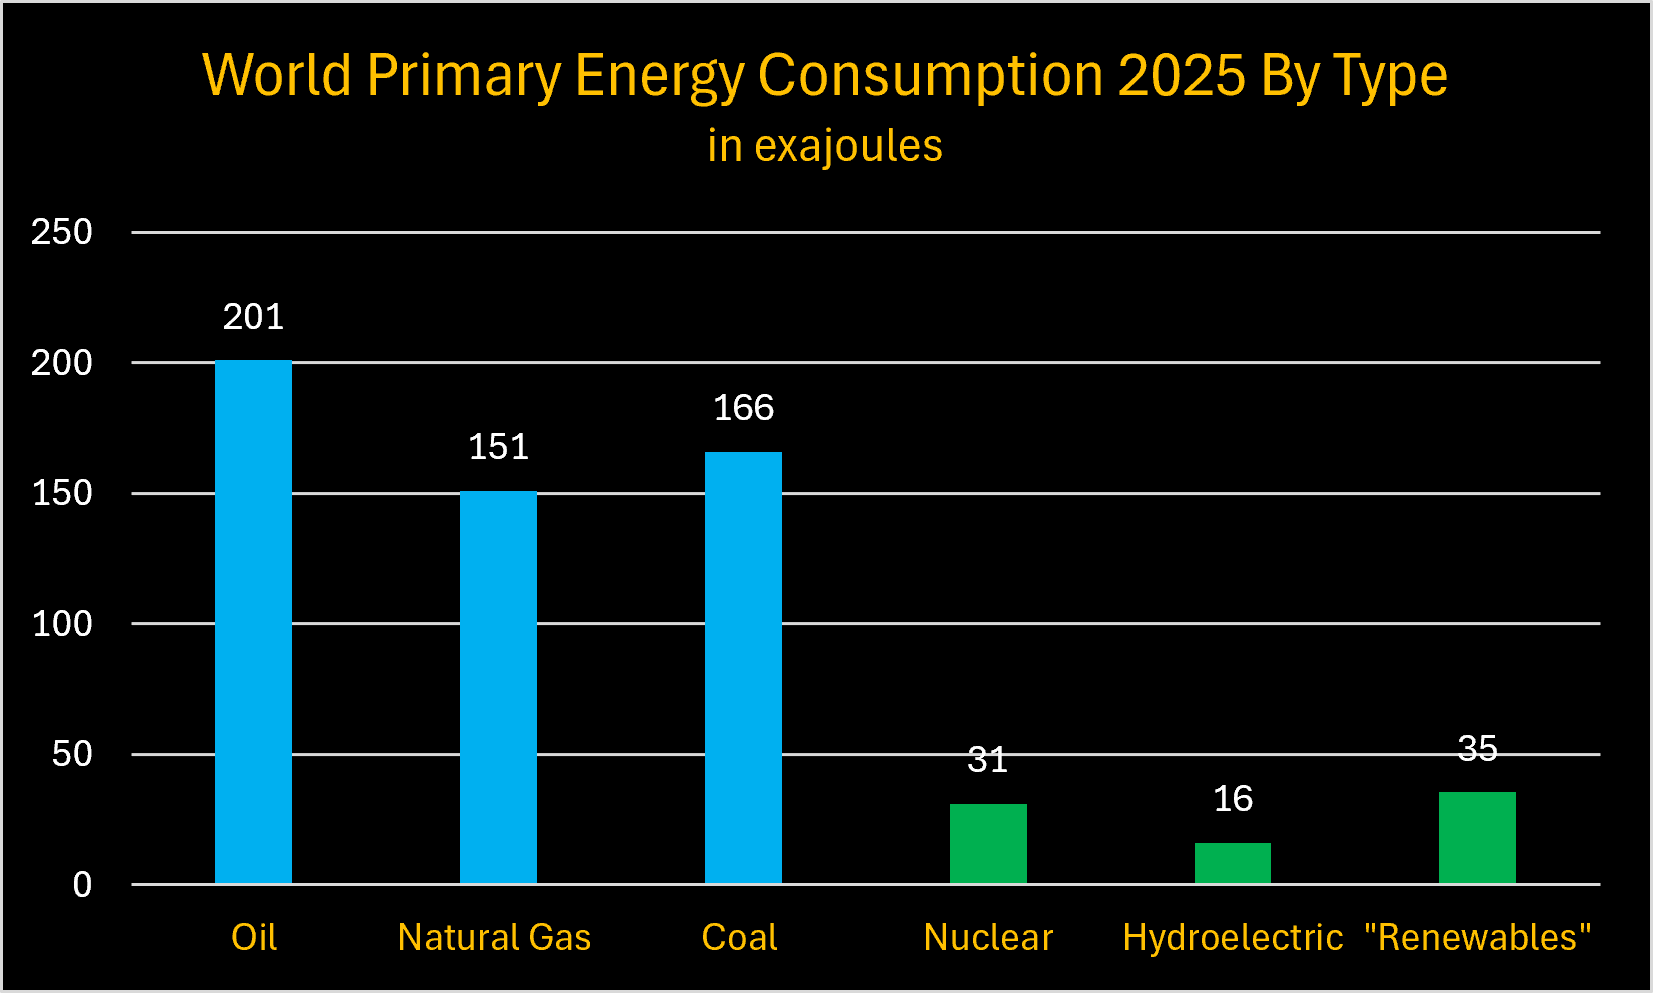
EI’s PowerPoint presentation did not say it, but we will. Since the Paris Agreement was signed in 2016, the portion of the world’s primary energy consumption provided by hydrocarbon energy (oil, natural gas, and coal) has declined by a whopping three percentage points, from 89% in 2016, to 86% by the end of 2025.
EI’s slide deck accompanying the press release for the 2026 Review put it this way:
“All forms of energy reached new highs for the second consecutive year. Renewables are the largest single source of growth, but fossil fuels still met 60% of the growth.”
As Roger Pielke, Jr. noted, of the ~8 EJ of new energy consumption added in 2025, “carbon-free” sources accounted for 44% (3.6 EJ, 3.2 EJ of which were “renewables”) but fossil fuel sources accounted for 4.6 EJ (56%).
EI’s launch presentation deck did its best to put a happy transition face on all of this. It also gladly pointed out the Bad Boy laggard by comparison.
One slide shows that total energy consumption in China rose by 2.4% in 2025, but 60% of that was met by “low carbon” supply. And it is true that China accounted for 1.8 of the 3.2 EJ in new “renewables” consumption globally.
The next slide shows that total energy consumption in the U.S. grew by 2.2%. It noted “US energy growth dominated by fossil, which met 88% of the 2025 change.” And the slide that followed noted that “US emissions grew 4x faster than China, representing nearly 40% of global increase.”
But China’s increase in oil consumption year-over-year in 2025 was more than double the U.S.’ in absolute terms. The increase in each country’s natural gas consumption was similar (.42 EJ for the U.S., .31 EJ in China). U.S. coal consumption increased by 0.8 EJ while China’s (reportedly) remained flat.
The net effect was that the pace of China’s emissions intensity reduction increased year-over-year. U.S. additional coal consumption caused American emissions intensity to increase slightly in 2025.
Another slide from the EI launch presentation appeared to present the happy transition story that growing electrification is increasingly being met by “low carbon.” It shows fossil fuels’ declining share in electricity generation in China, the U.S., India and the European Union (EU). But in doing so, it inadvertently visualized one of unavoidable consequences of said “energy transition.”
The slide shows fossil fuels still provide ~60% of the electricity in the U.S. and China and approaching 80% in India. For the EU, the figure is 30%.
The framing of the U.S., China, and India by comparison suggests that EU’s low share of electricity generation from hydrocarbon energy sources is a virtue. But is it?
Over the period shown (2015 – 2025), average economic growth was:
· ~6% in China and India
· ~2.5% in the U.S.
· Barely 1.4% in the EU
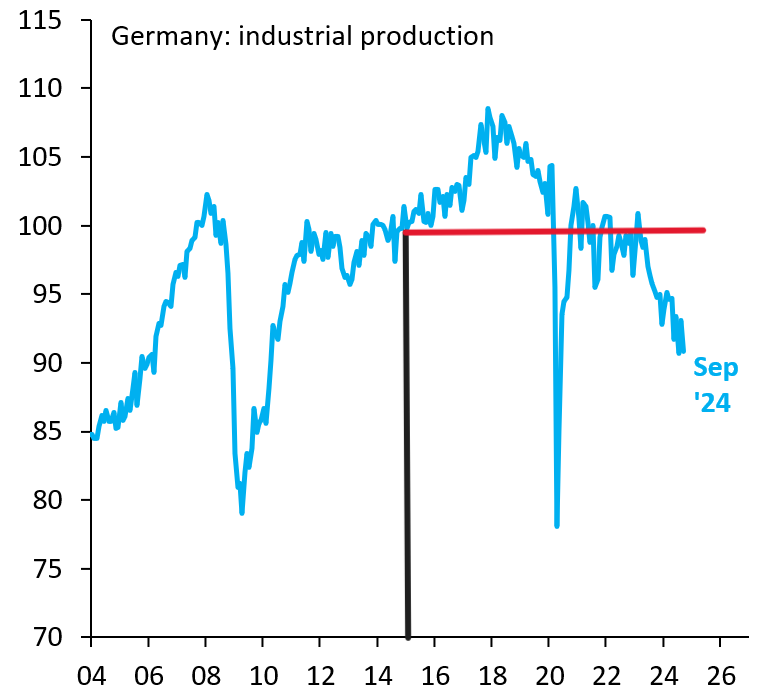
Germany is the economic and industrial powerhouse of the EU. In nominal terms it has the highest electricity prices on the European continent. Viewed through the lens of Robin Brooks X post from November 2024, the EU’s mid-30’s% share of electricity generation from fossil fuels starts to look more like a vice – in the literal, two-definition sense – than a virtue.
We believe a better comparison of the world’s largest CO2 and GHG emitters comes via direct comparison over the period since the Paris Agreement was signed by both the U.S. and China. And the 2026 Review provides the data to do so easily and directly.
The U.S. and China are the world’s largest consumers of liquid and solid (coal) hydrocarbon energy. Together the two consumed 220 of the 518 exajoules (42%) of oil, natural gas and coal burned by the world in 2025. The next four charts compare U.S. and China consumption of oil, natural gas, coal and renewables from 2016 - 2025 (we have not shown nuclear and hydroelectric because they have not materially changed in either country).
Oil:
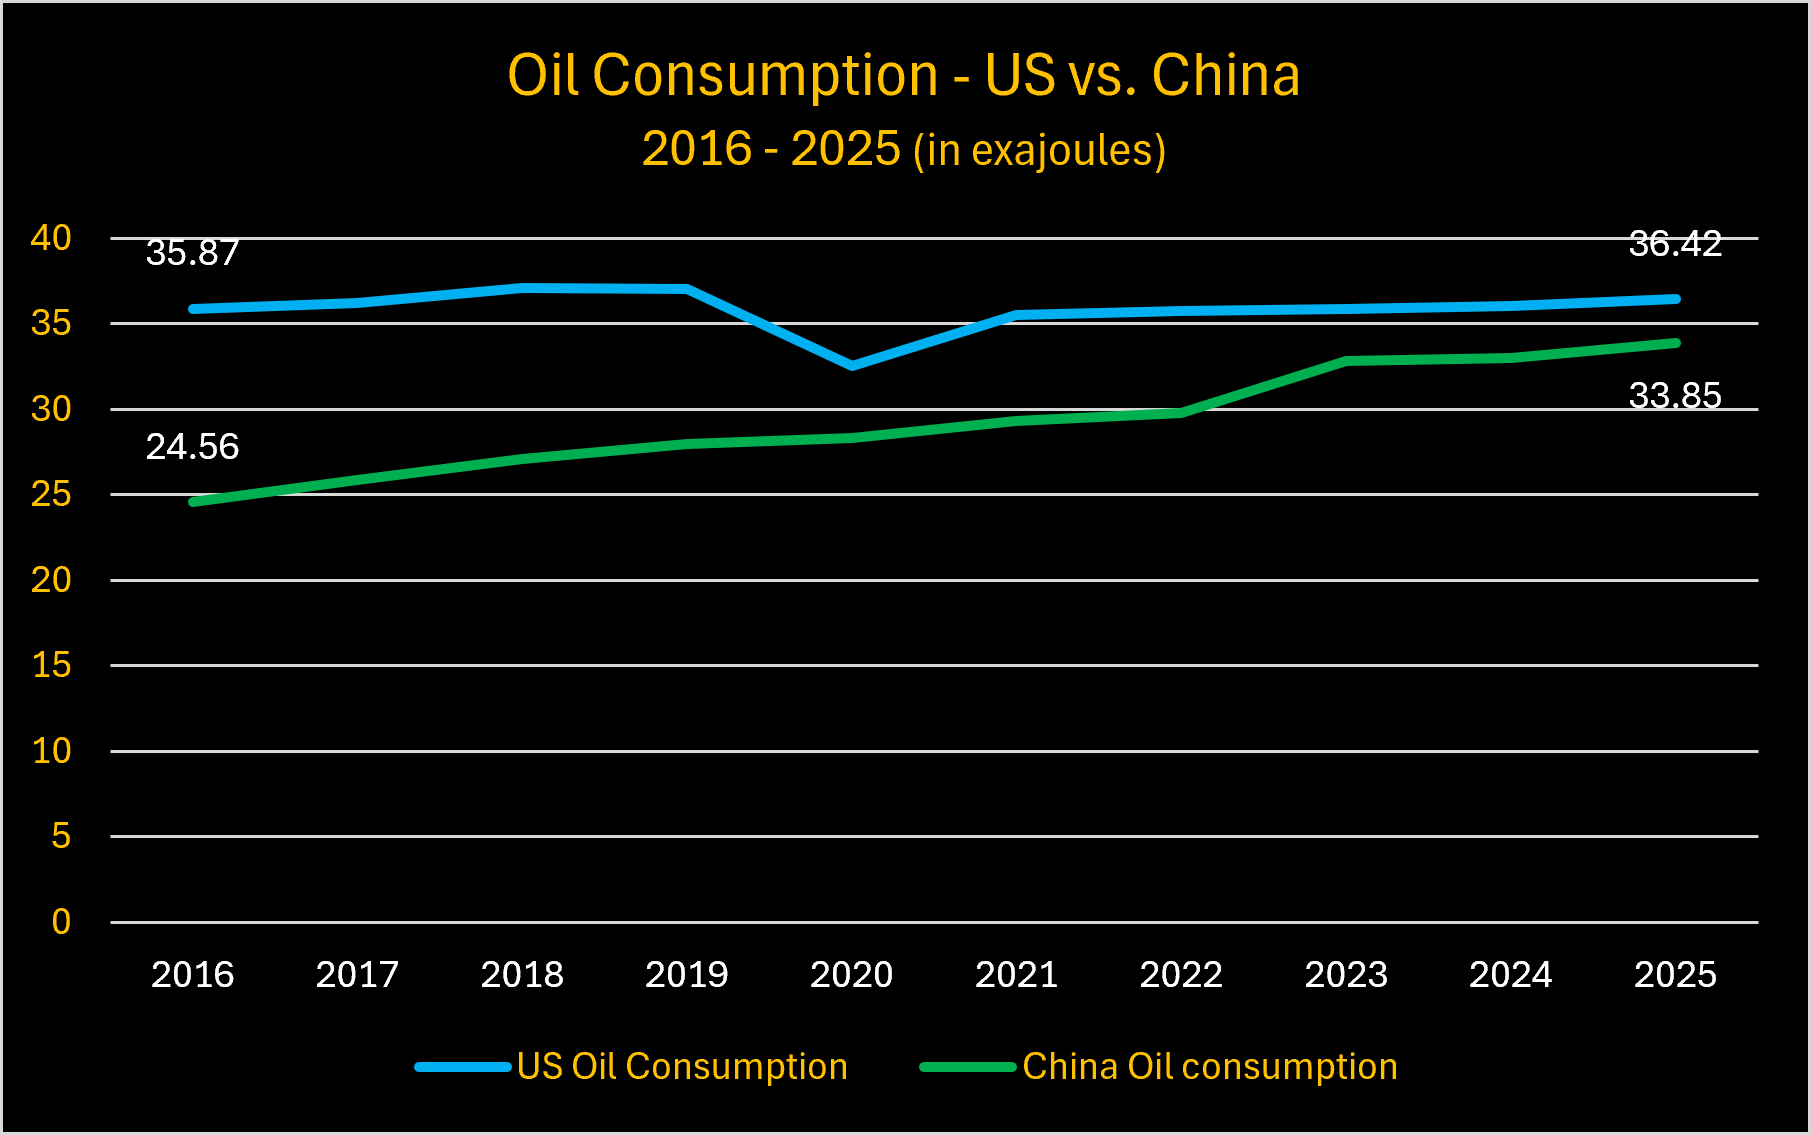
The ten-year trajectory for U.S. oil consumption is nearly flat. China’s oil consumption is still rising.
Natural Gas:
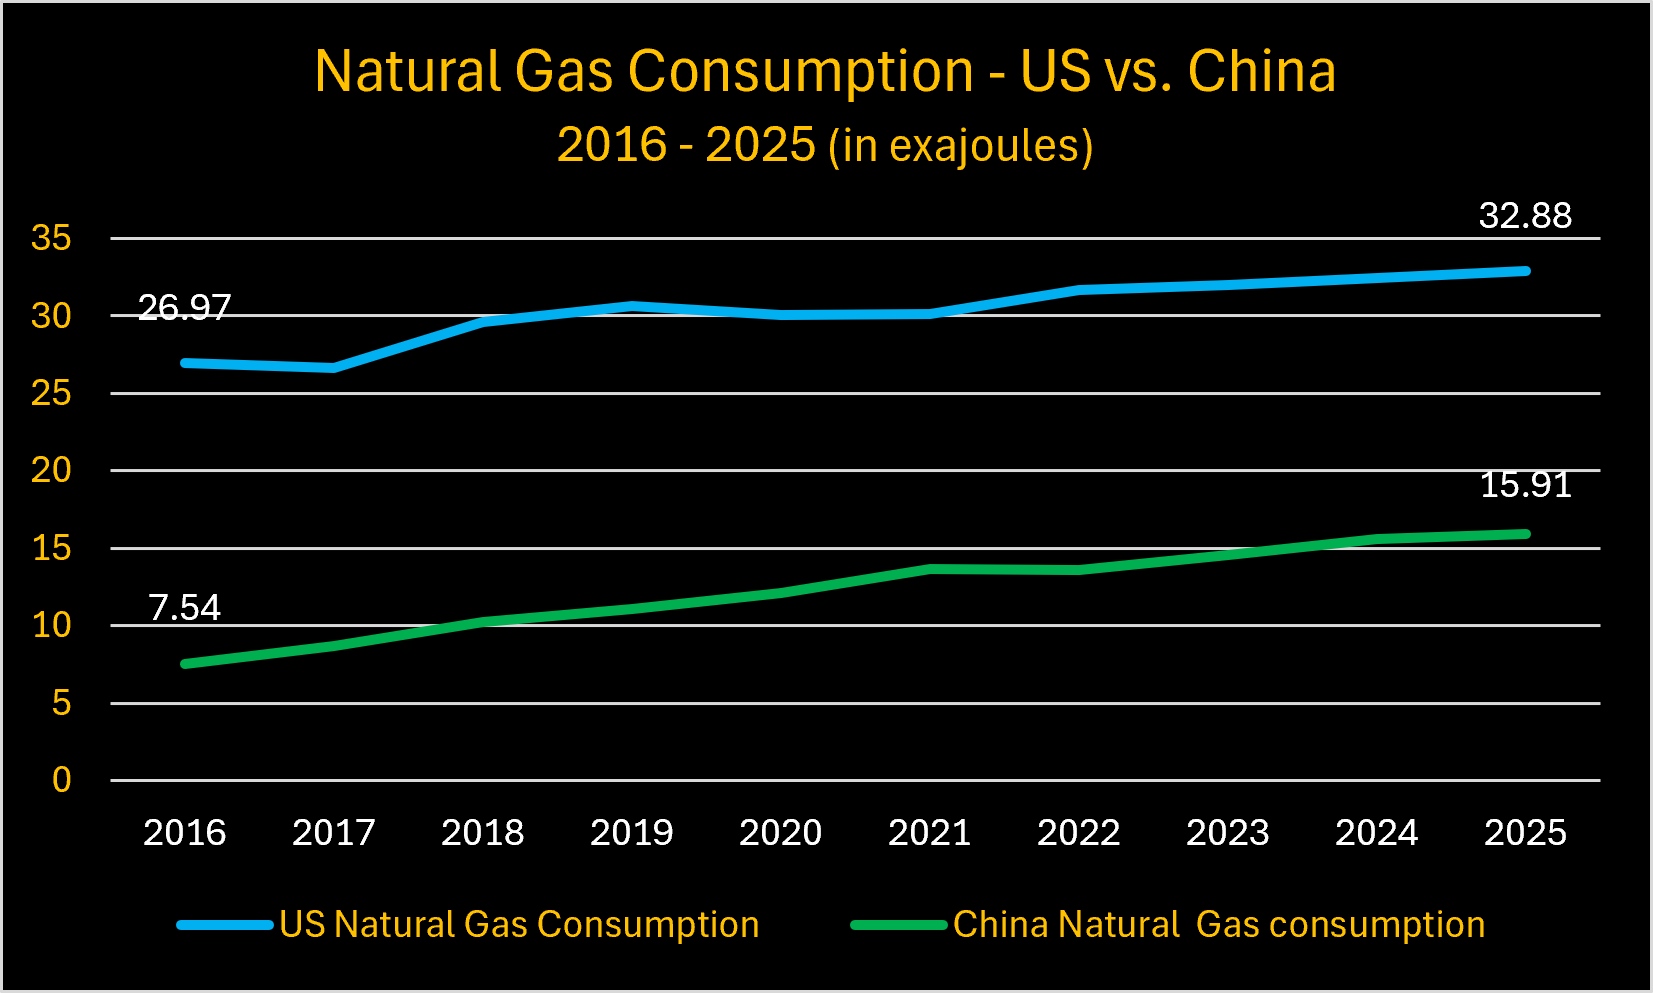
Natural gas consumption is still increasing in the U.S. and China. U.S. consumption doubled since 2015, but it did so at the expense of U.S. coal consumption (driving down U.S. CO2 emissions intensity in the process.)
Coal:
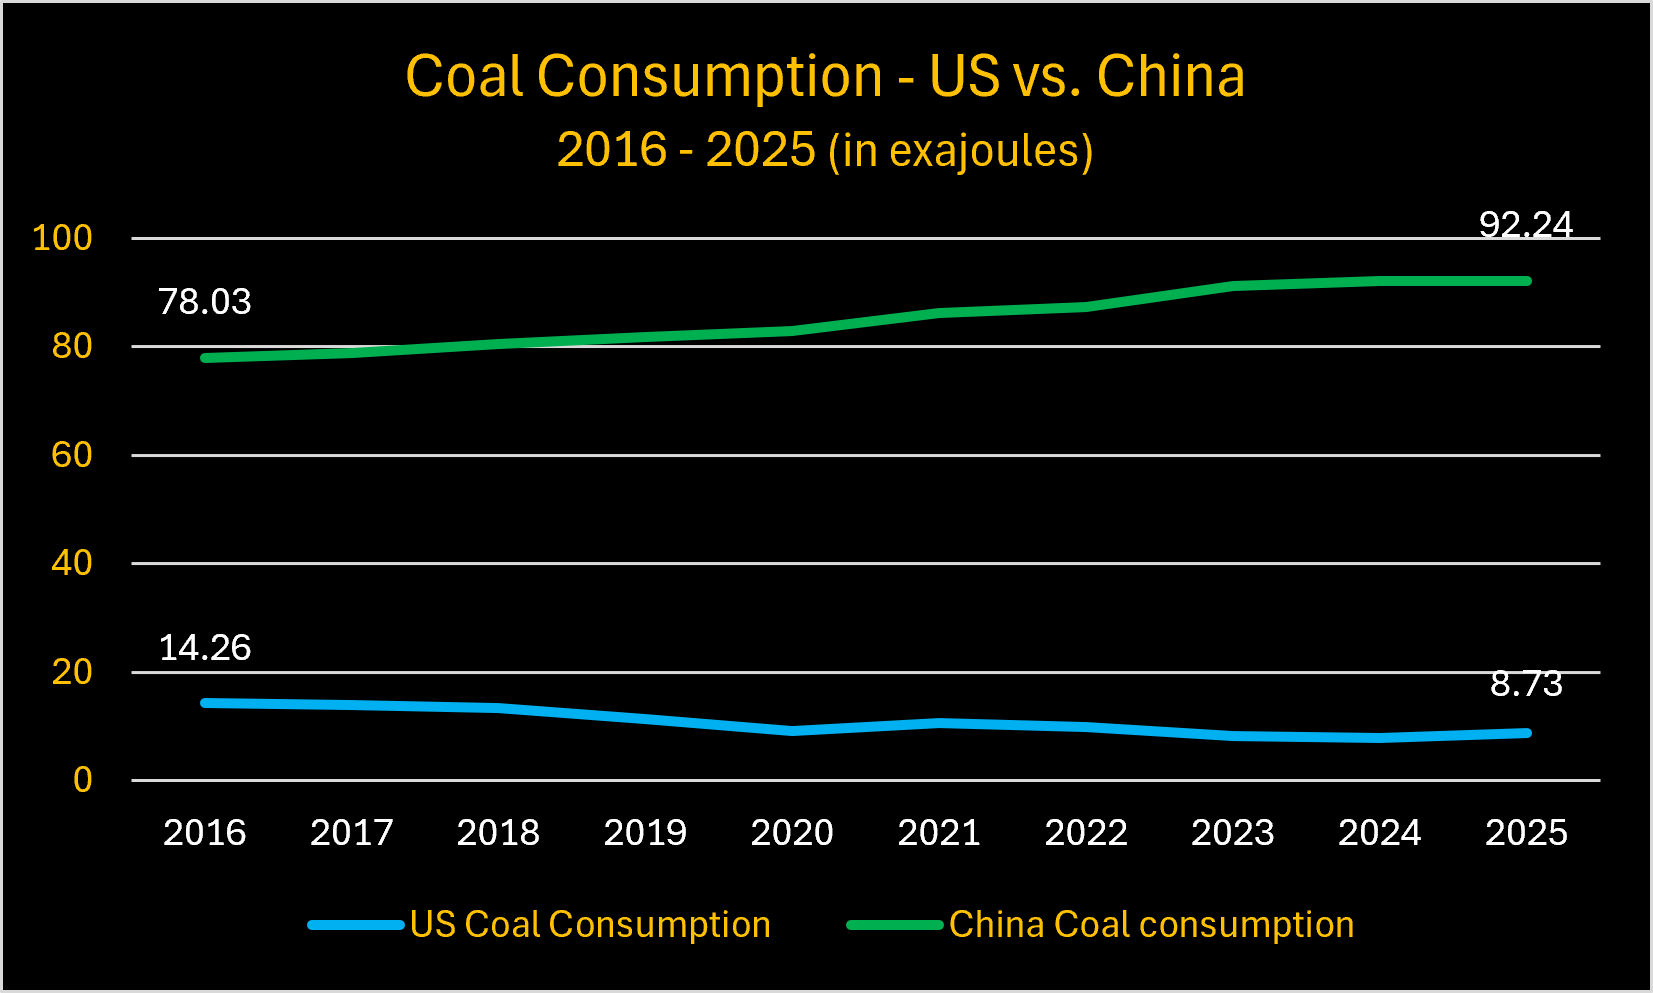
Coal is where the differences between the U.S. and China really stand out in terms of hydrocarbon energy consumption. U.S. coal consumption is down by 39% since 2015. But after building a new coal-fired power plant on average every couple of weeks for well more than a decade, China today consumes >10 times more coal than the U.S.
“Renewables”:
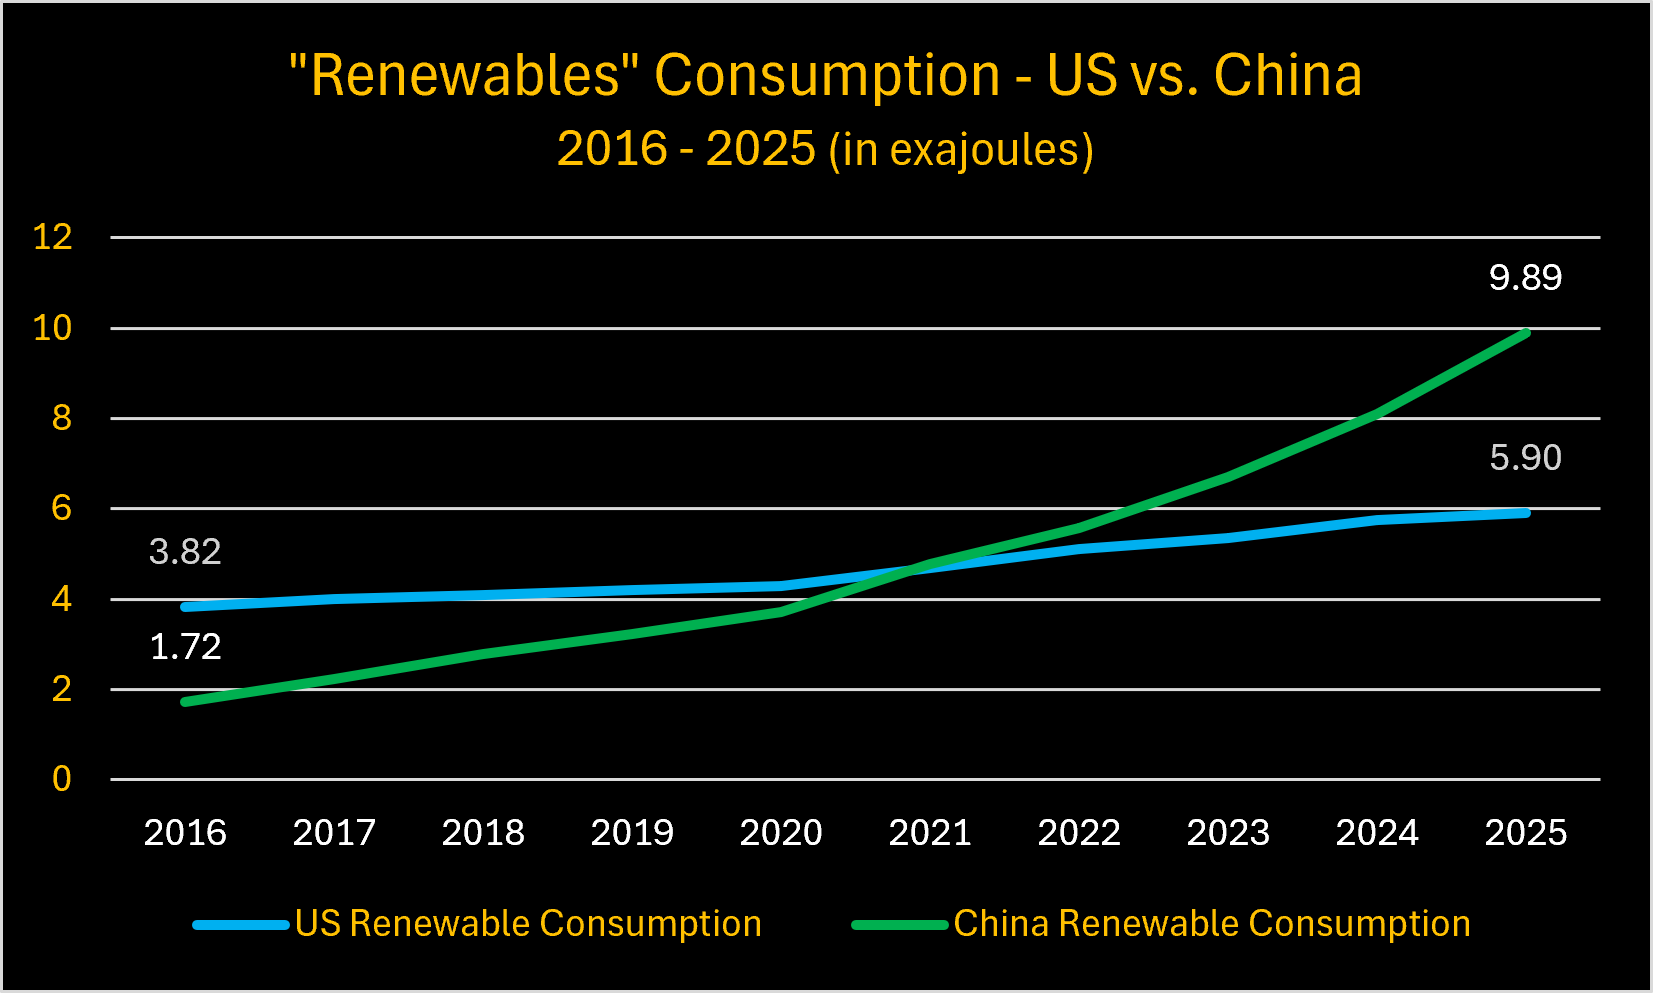
The growth of Chinese renewable energy consumption (and capacity installation) speaks for itself. It now consumes about 70% more energy from “renewables” than the U.S. How much of that is a function of building too much wind and solar capacity and having to soak up some of it domestically for economic reasons vs. for national security priorities is anyone’s guess. But it certainly wasn’t to “save the planet.”
The following chart combines all of the U.S. and China hydrocarbon energy consumption figures above into a single visualization for simple comparison.
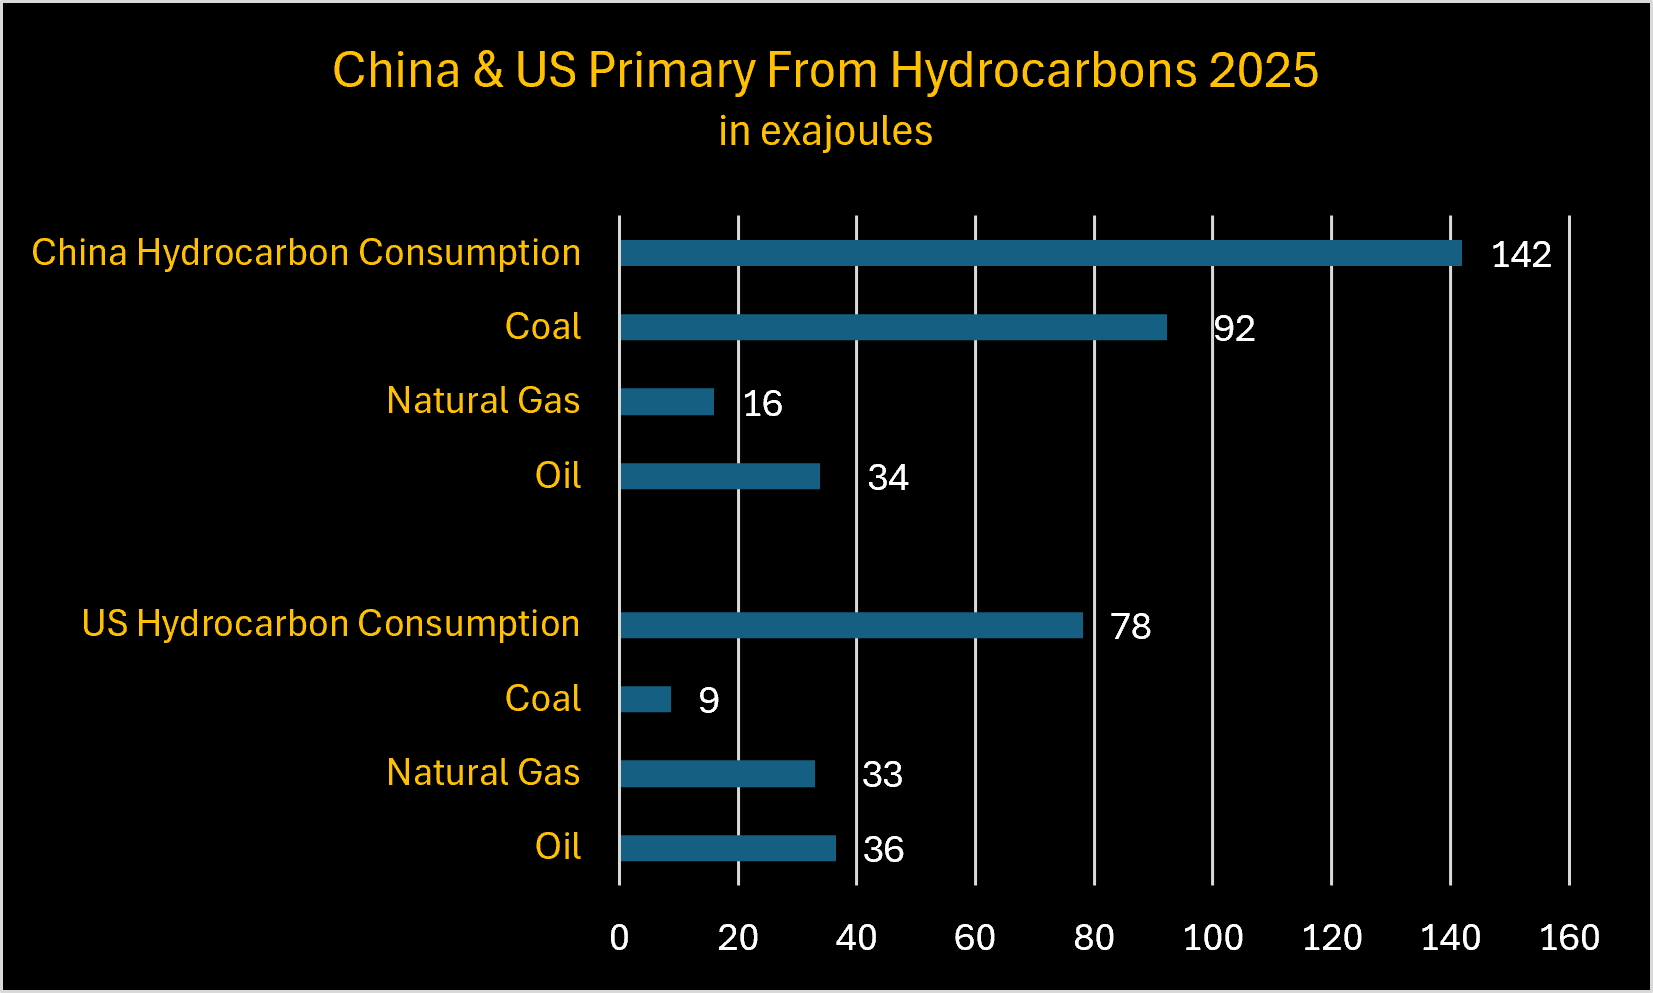
For 2025, China’s total of 142 EJ was 1.8 times more total hydrocarbon energy than combusted by the U.S. (78 EJ). The above comparisons were not included in EI’s slide presentation deck for the 2026 Review release, but we are happy to provide readers with that necessary context.
At the conclusion of the EI release teleconference, President Andy Brown commented on “lessons from prior crises and oil trade flows ahead of the ME conflict,” presenting two slides titled “Hormuz Crisis – Self Sufficiency.” The first slide compares U.S oil and gas production vs. consumption with that of the UK.
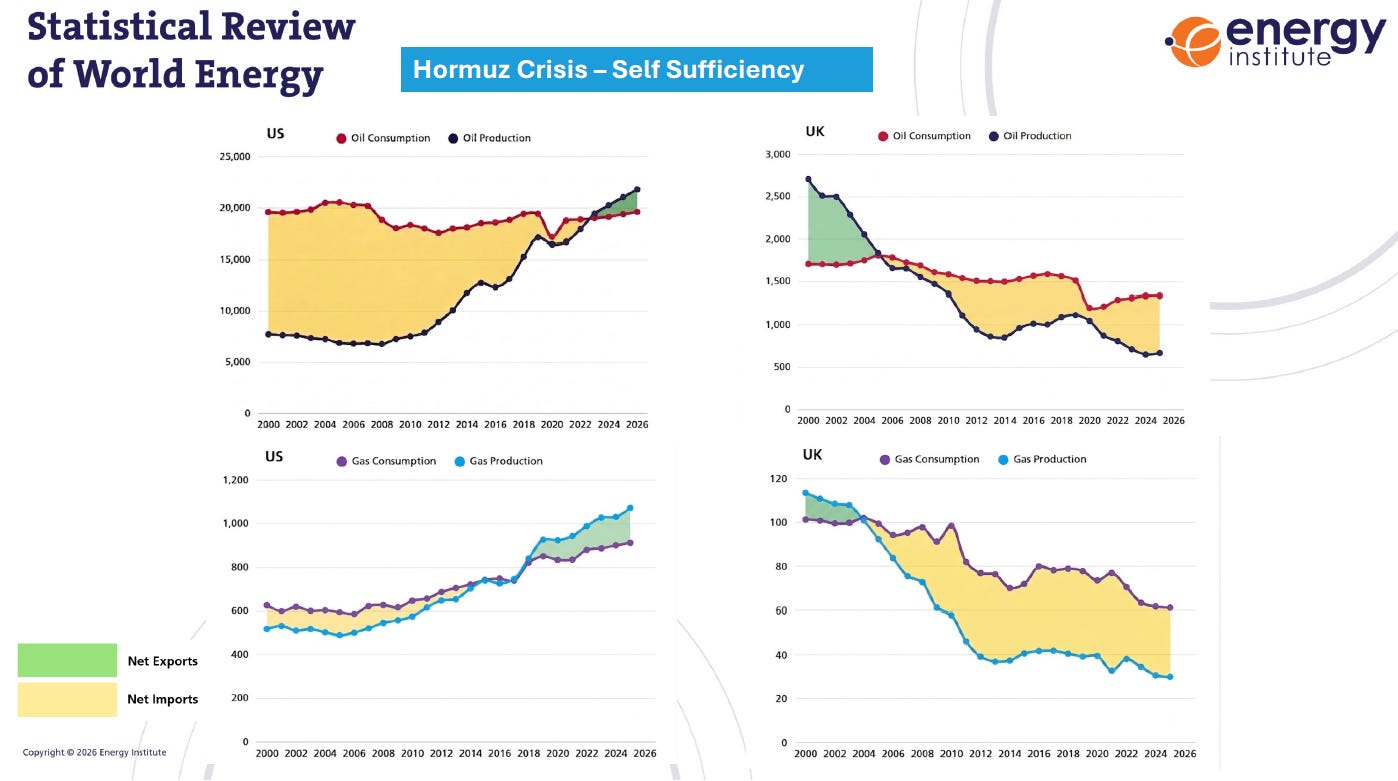
The obvious UK deficit is a problem we, Doomberg and others have been warning about for some time. The U.S. is a net exporter of both oil and natural gas. The UK, a net importer of both fuels, is what Doomberg often rightly calls an “energy vassal.”
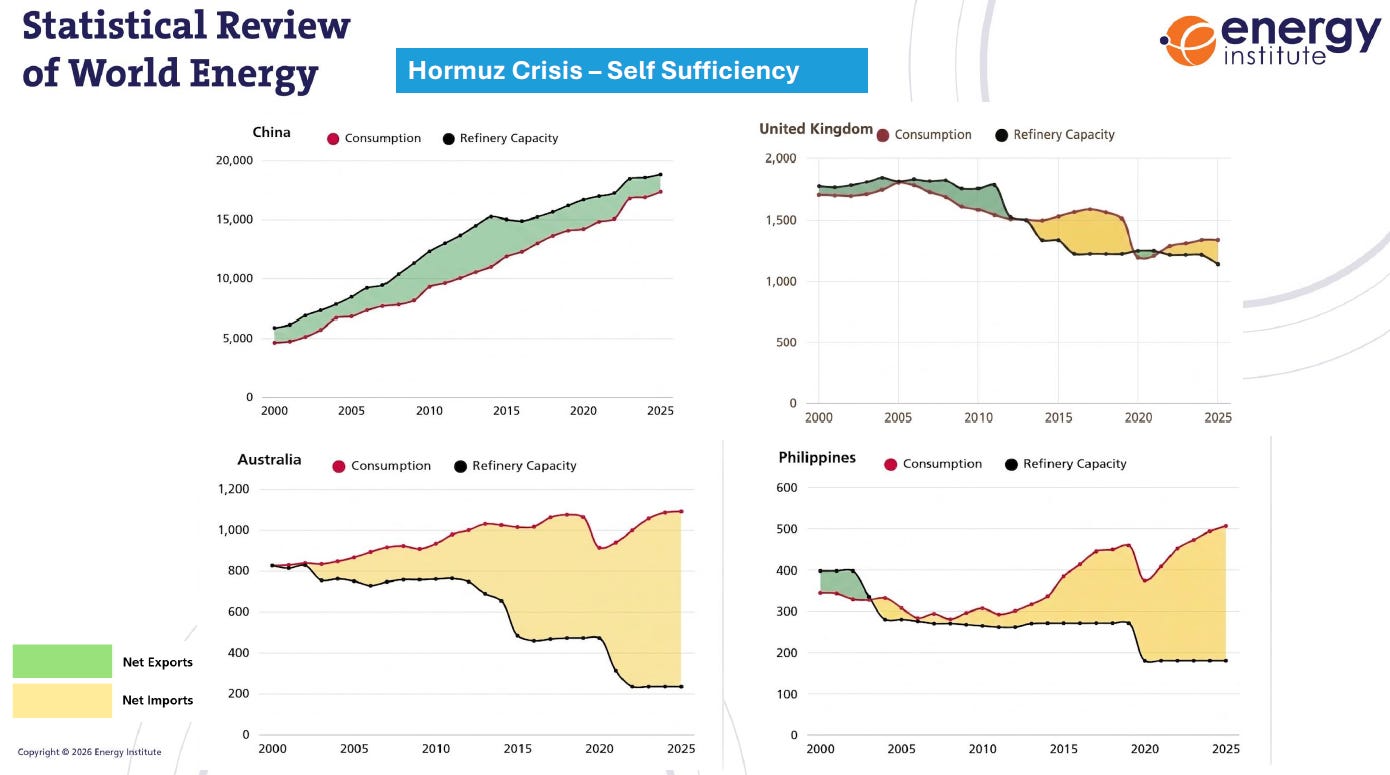
The second slide curiously compares oil consumption with refining capacity in China, Australia, the Philippines and the UK, all of which are net importers. It is not obvious what anyone learned that was not known to most energy observers by EI including these two slides.
Like Doomberg, we have quantified the gap between EU hydrocarbon energy consumption and production. It is as if the lessons that caused Jimmy Carter to symbolically put solar panels to heat almost 70% of 1,000 gallons of water on the roof of the White House caused Europe to make its own energy security more tenuous. The 2026 Review shows that dire situation is unchanged.
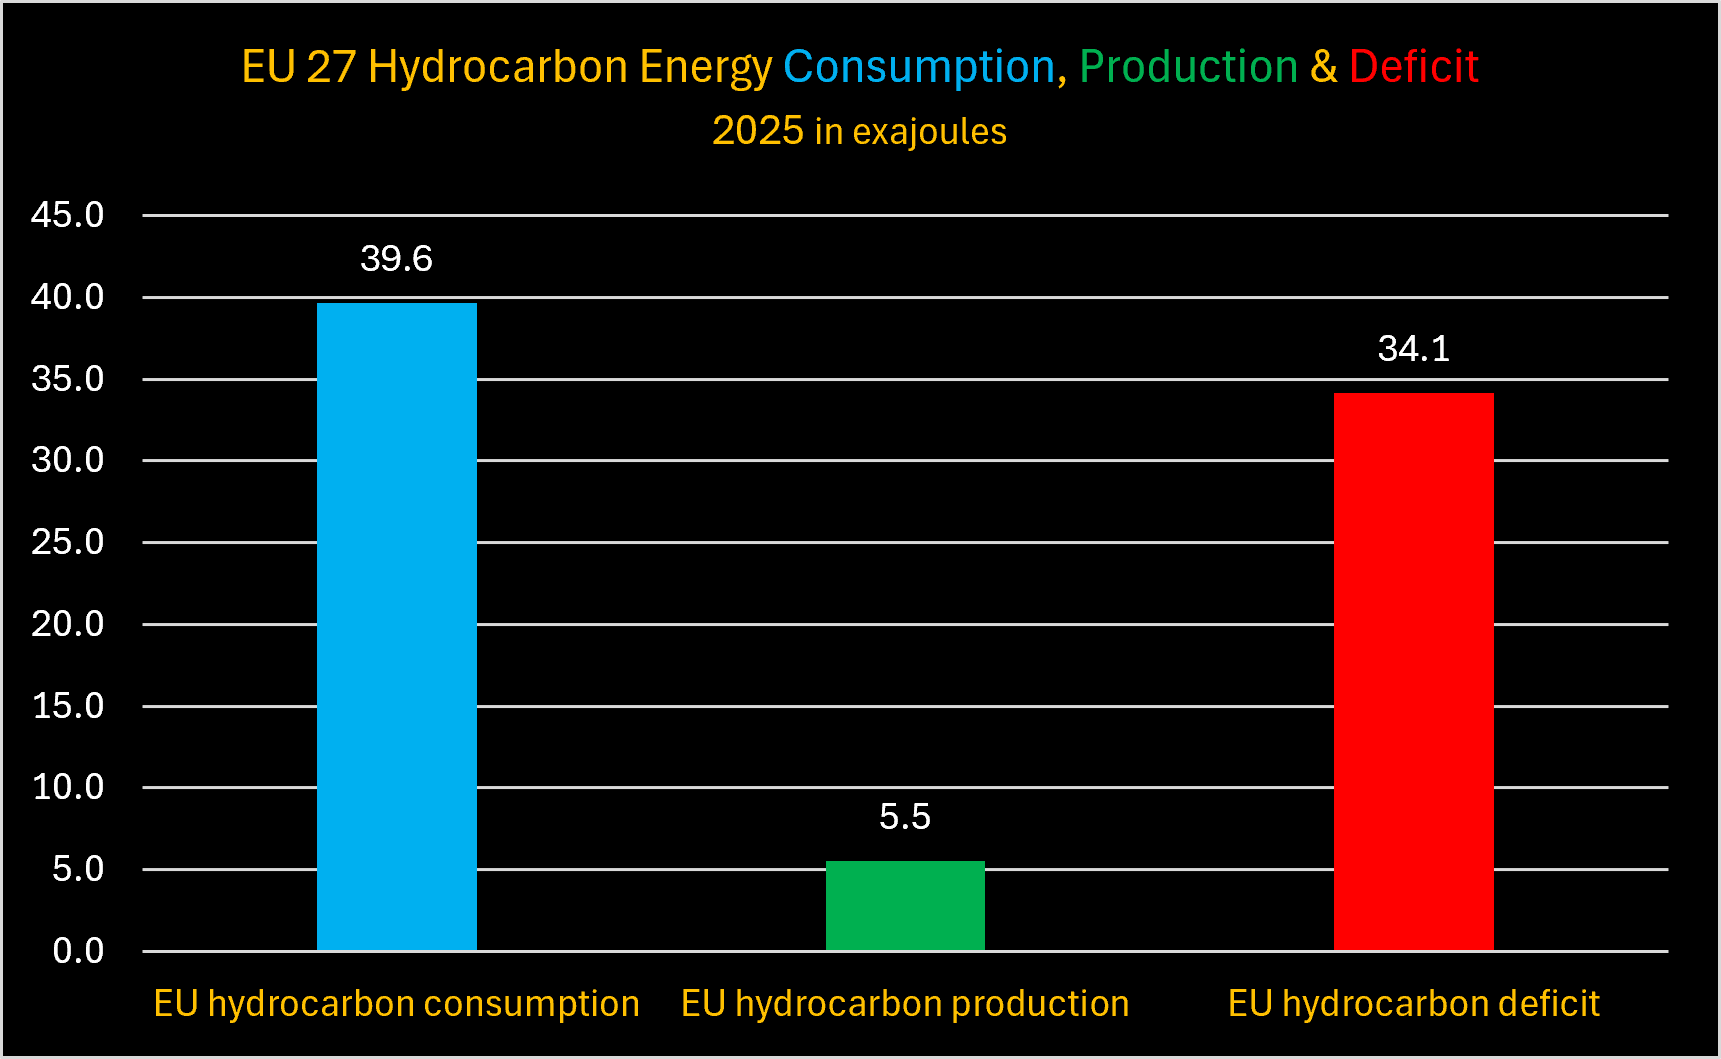
Contrast that with U.S., an energy power unlike any other on earth. The U.S. produced 21% of the world’s liquid petroleum products and 26% of the world’s natural gas in 2025. America is a net exporter of both.
We updated earlier analysis regarding energy surpluses and deficits using the new SROWE figures. But for heavy sour crude cuts that the U.S. is importing from the Middle East (that it could arguably get from Venezuela and/or Canada), as we, Doomberg and others have shown in the last couple of years, the U.S. no longer needs Middle East oil, and it damn sure doesn’t need natural gas from that region. In fact, North, Central and South America combined produce an oil surplus that renders oil security and the Middle East largely meaningless to the Americas.
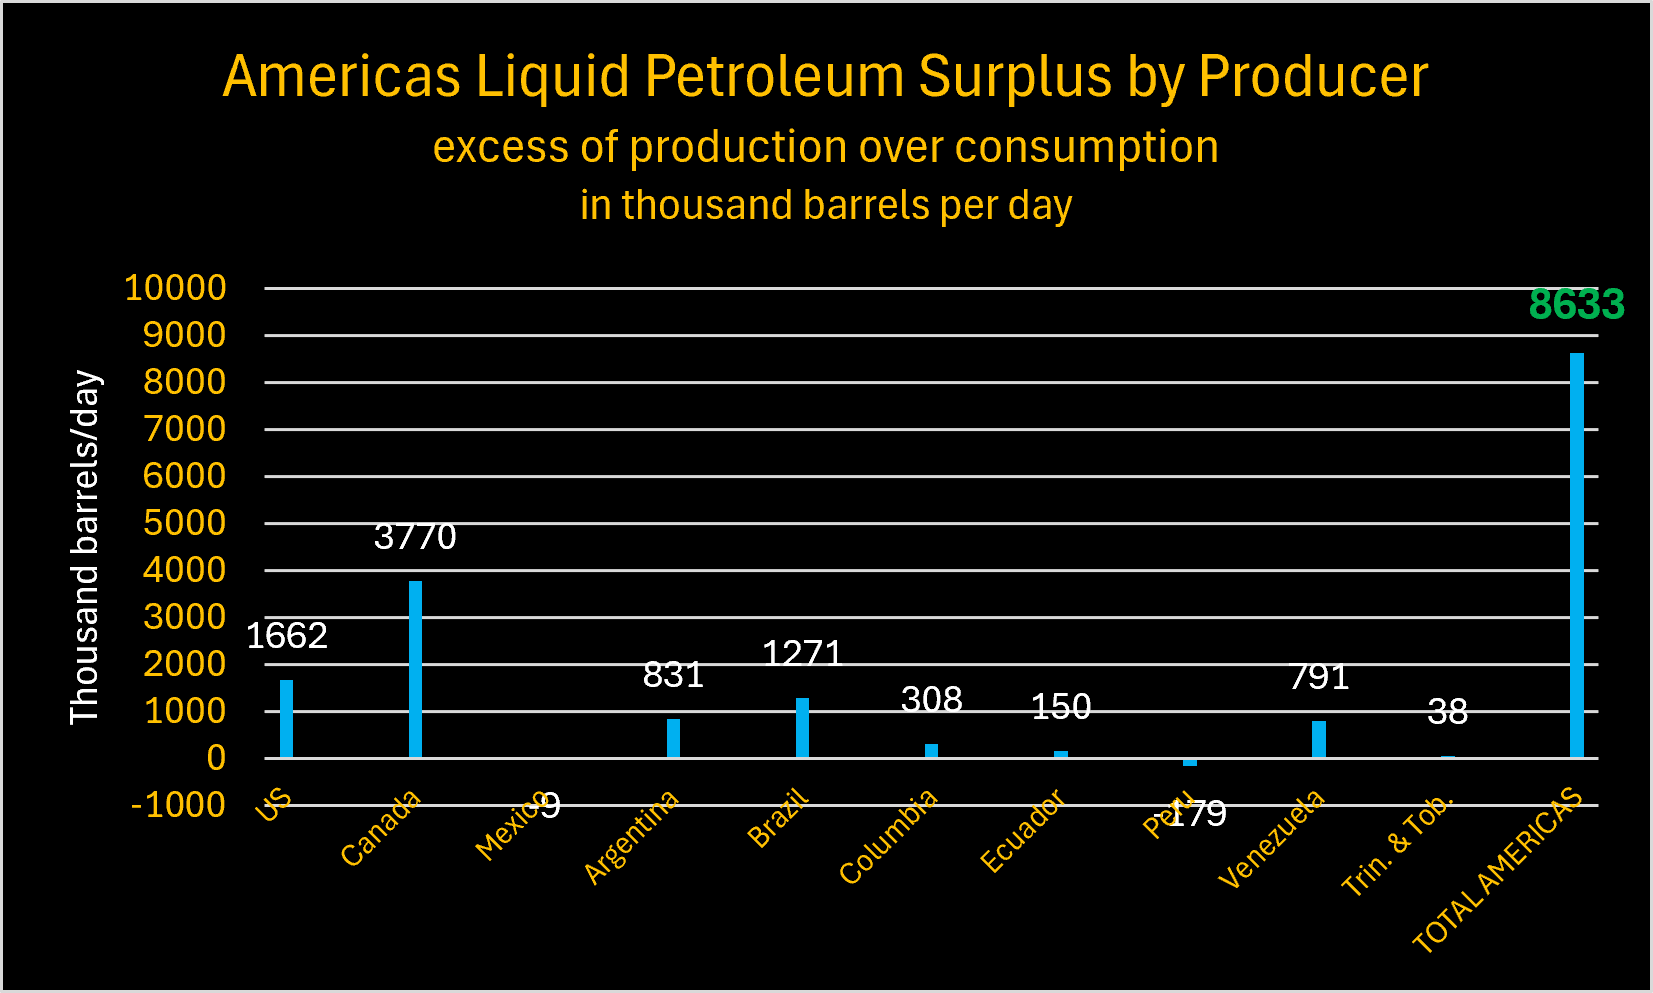
For 2025, the Middle East produced 30 million bpd and only consumed 9 million. Russia produced 10.7 mmbpd and only consumed 3.7 mmbpd.
The combined surplus of oil production over consumption in the Americas, Middle East and Russia was 35 million bpd in 2025. Europe, China and Southeast Asia’s economies are all dependent on that surplus, and the same is true with natural gas.
And while the margin between China’s oil refining capacity and its consumption on the graph Mr. Brown presented does not appear to be significant, it does not show Chinese domestic oil production, and the absolute barrels per day figures tell a different story.
Oil:
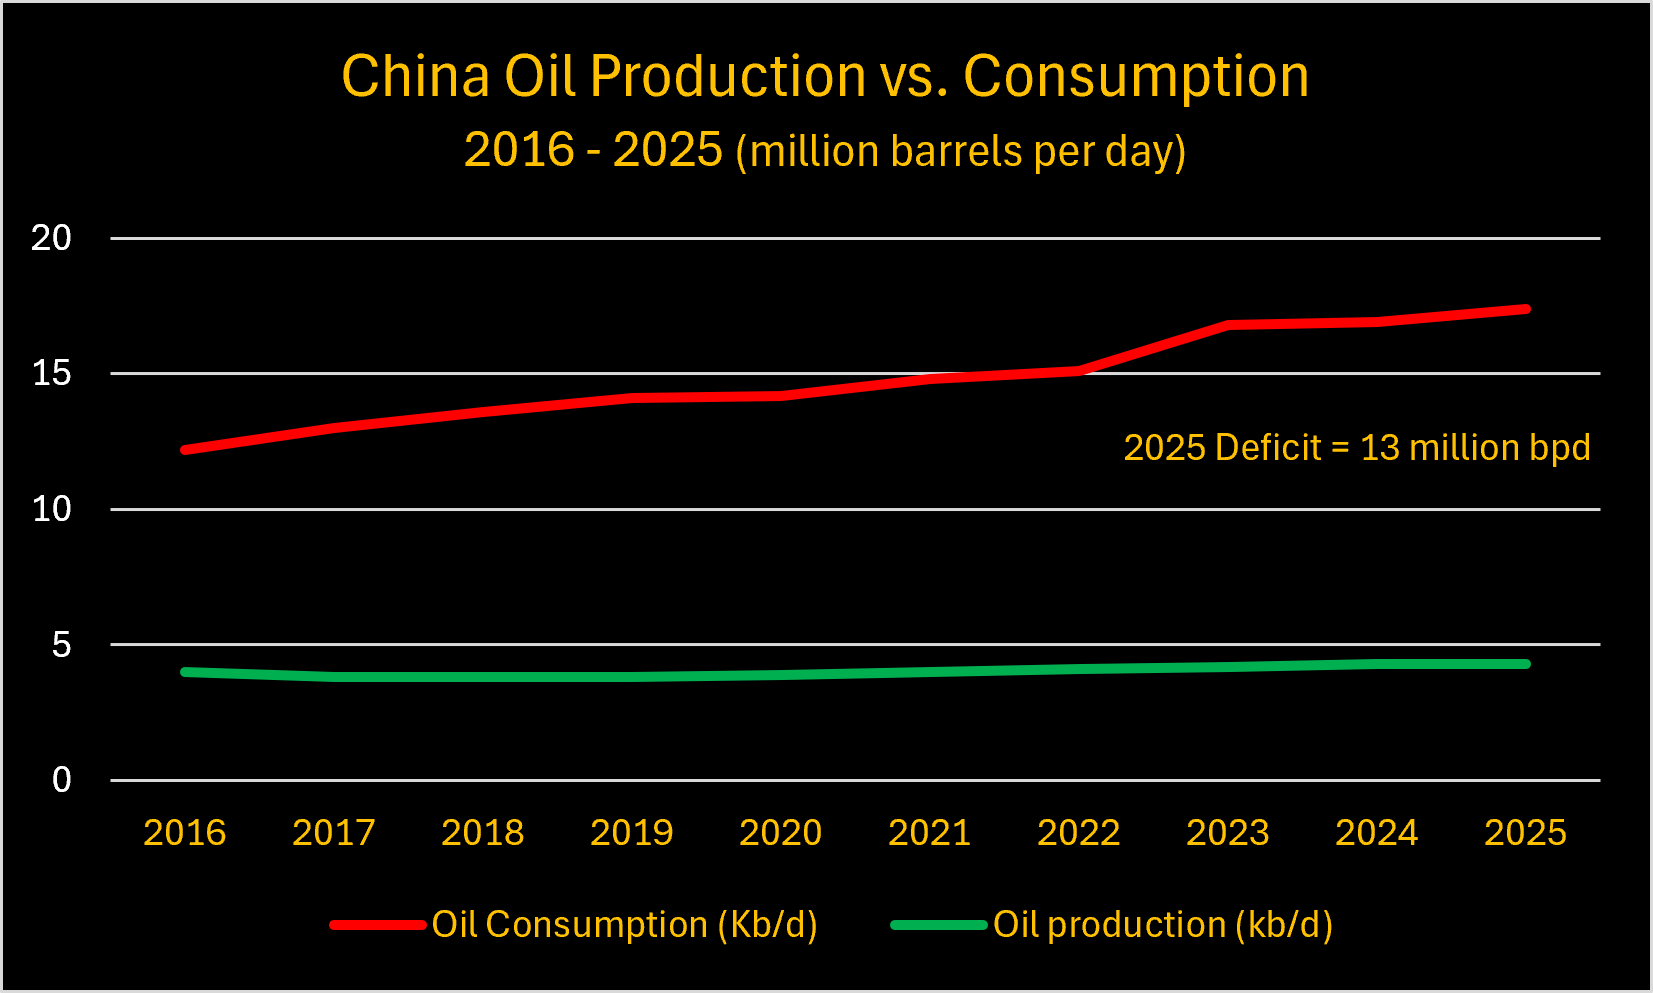
China’s 13 mmbpd deficit is greater than Russia’s entire crude oil production.
Natural Gas:
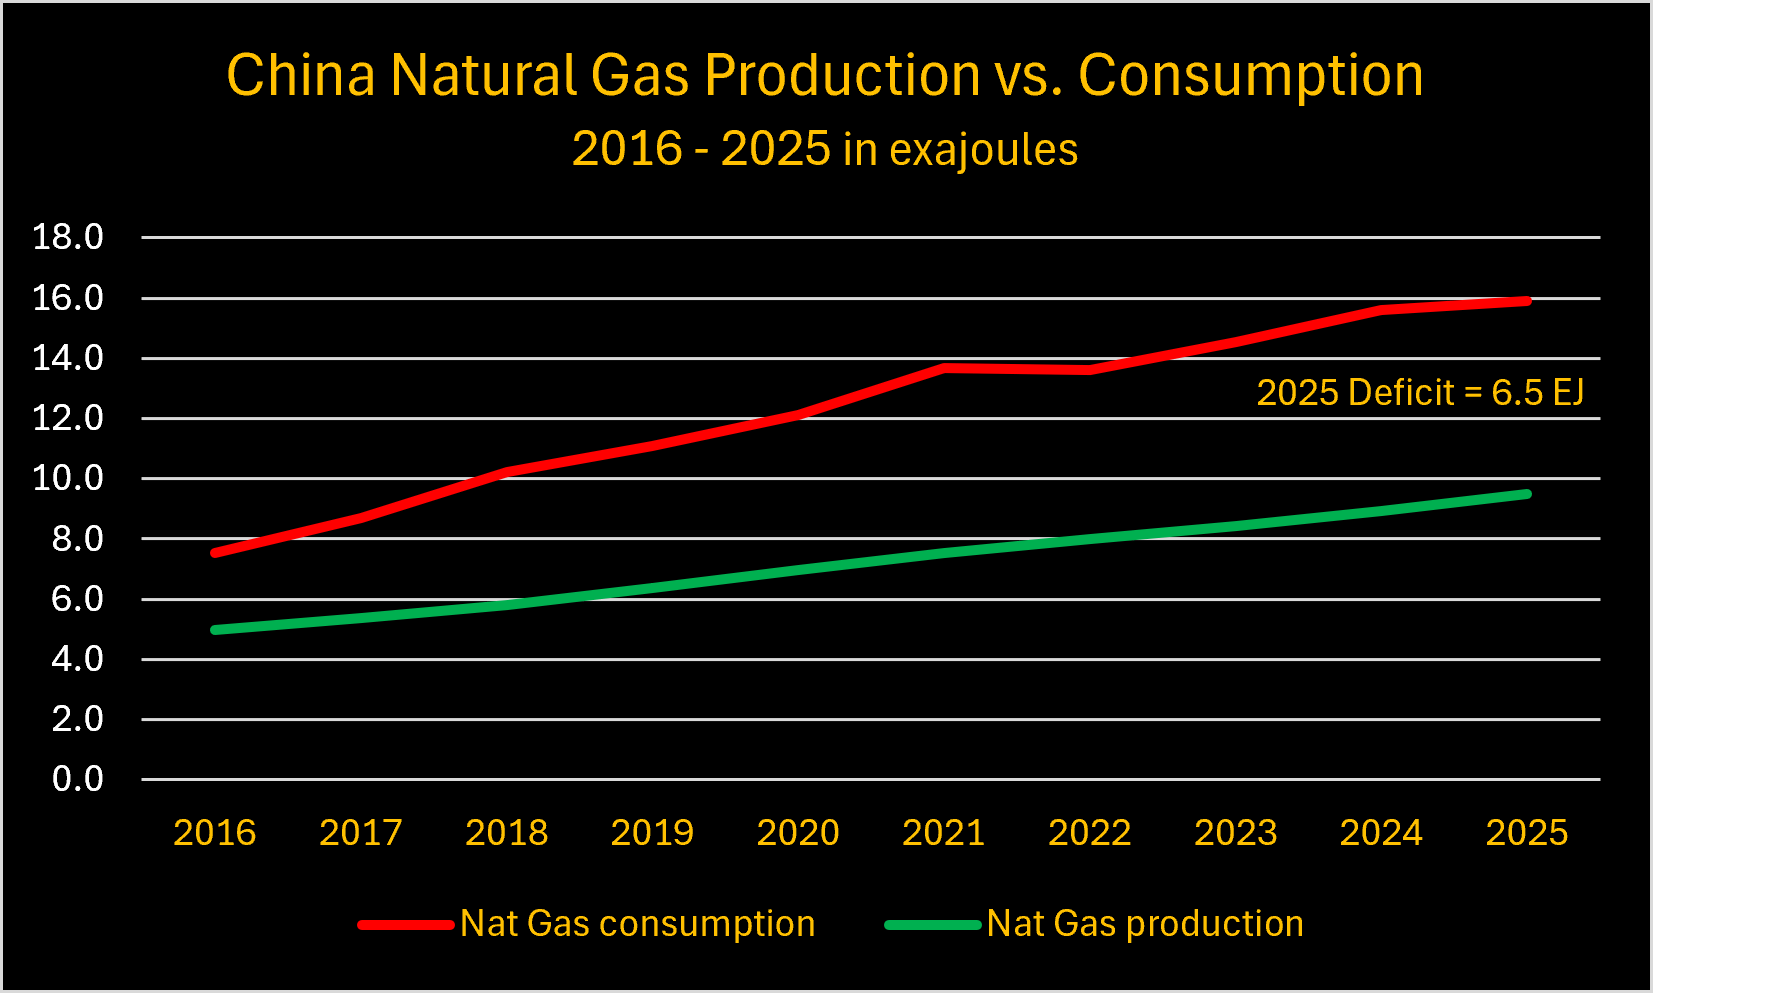
In natural gas the story is much the same. China consumed almost 16 exajoules of natural gas in 2025 but only produced 9.5 domestically, covering only ~60% of China’s natural gas consumption. For now, China has to import most of the balance from Australia, Qatar, Russia, Malaysia and others (including some cargoes from the U.S.) in the form of LNG, at least until a much discussed pipeline project from Russia comes to fruition.
As we noted from our very first post on Substack, the direct correlation between energy consumption and economic growth is so tight and well established as to be undeniable. Most people still consider energy a derivative of the economy. Those who do so have it completely backwards.
Economies are derivatives of energy. Energy is the economy. Look no further than Venezuela for the most recent example.
From 2016 to 2024 the cumulative decline in Venezuela’s real output was ~35%, even after posting modest positive growth after 2021 according to the IMF/World Bank. (2025 data is still available only as provisional estimates).
Total Energy Supply in Venezuela fell from 2.81 exajoules in 2016 to 2.03 by the end of 2025. The 28% decline closely mirrors the decline in Venezuela’s GDP.
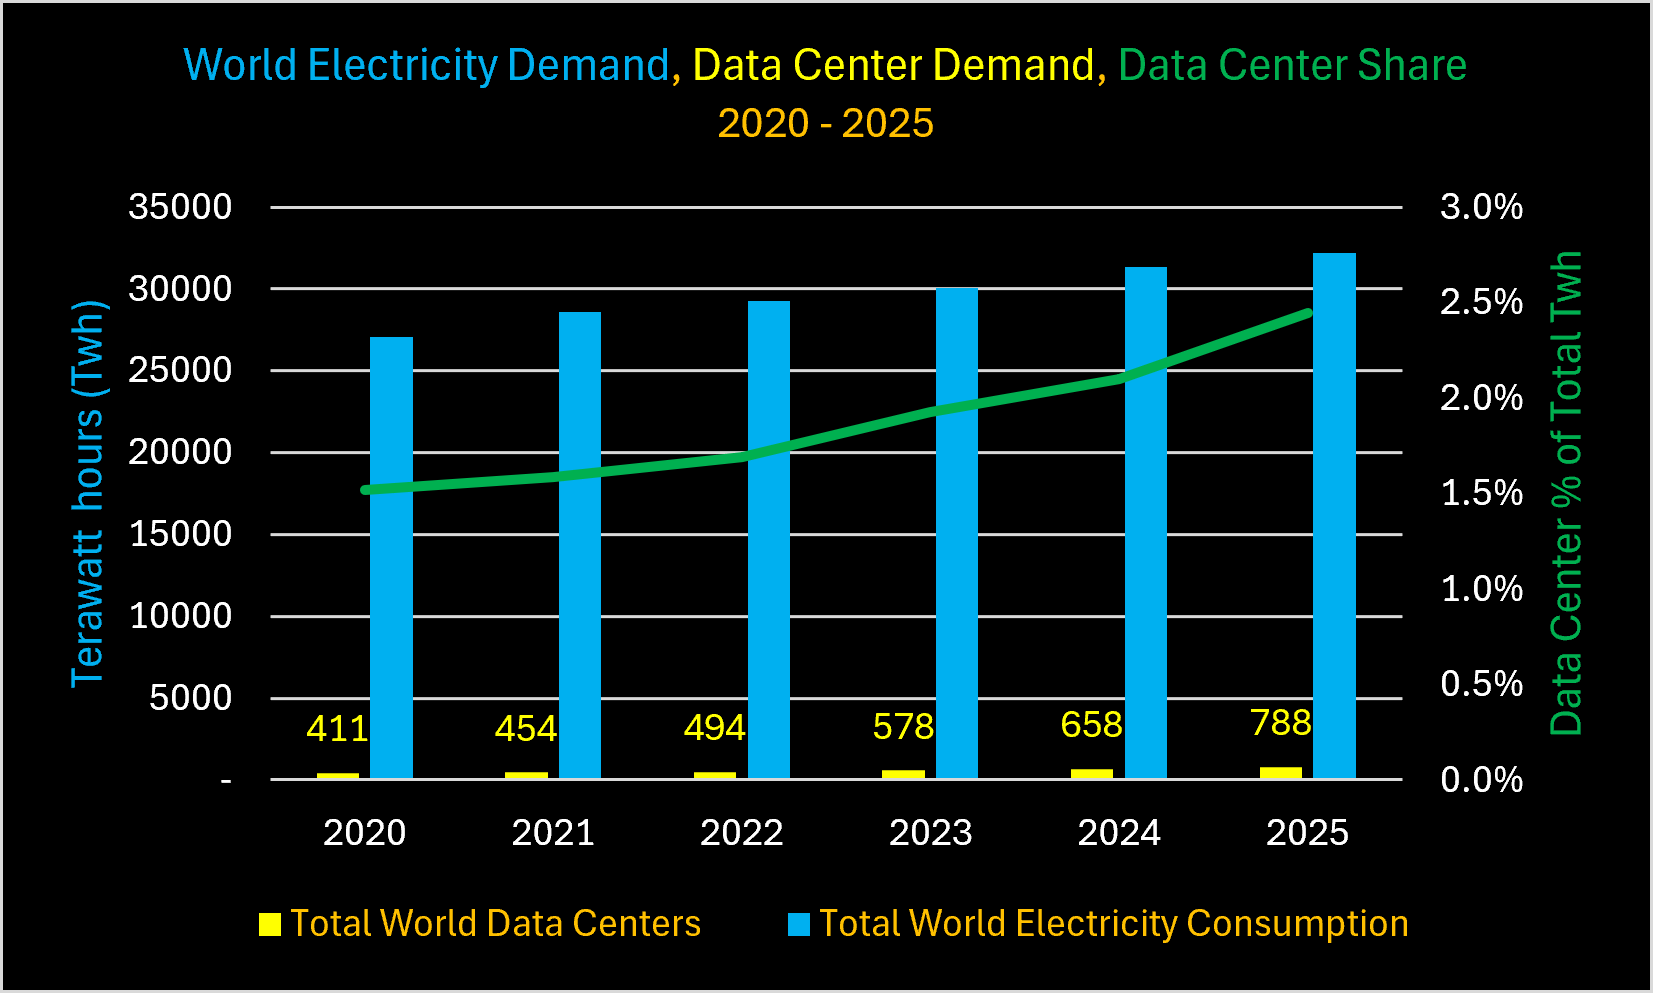
Finally, at the opposite end of the spectrum from Venezuela are the planet’s new energy hogs: data centers. For the first time, the 2026 Review captures global data center energy use.
In 2020, the first year of data center energy consumption shown, Our Tech Overlords new hogs hoovered up ~1.5% of global electricity generation. By the end of last year, data centers consumed ~2.5% of the world’s electricity.
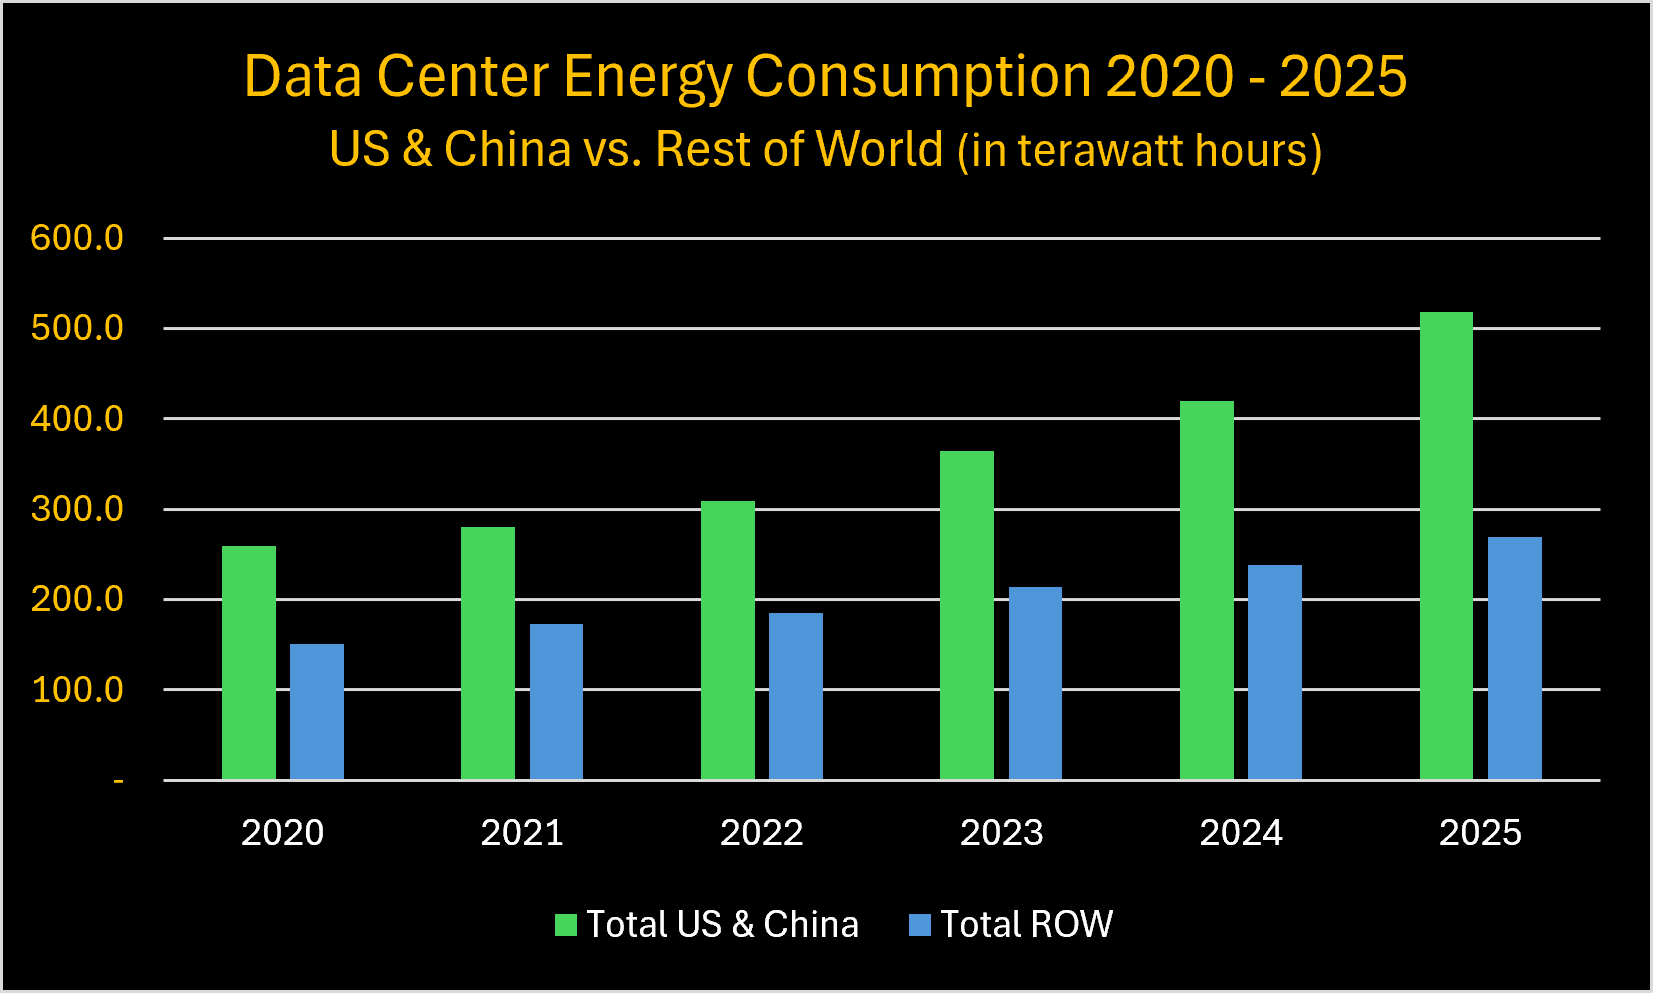
The U.S. and China dominate that growing demand. Together, the two nations who appear to be locked in an AI arms race of sorts sucked up 66% of the world’s data center electricity consumption in 2025.
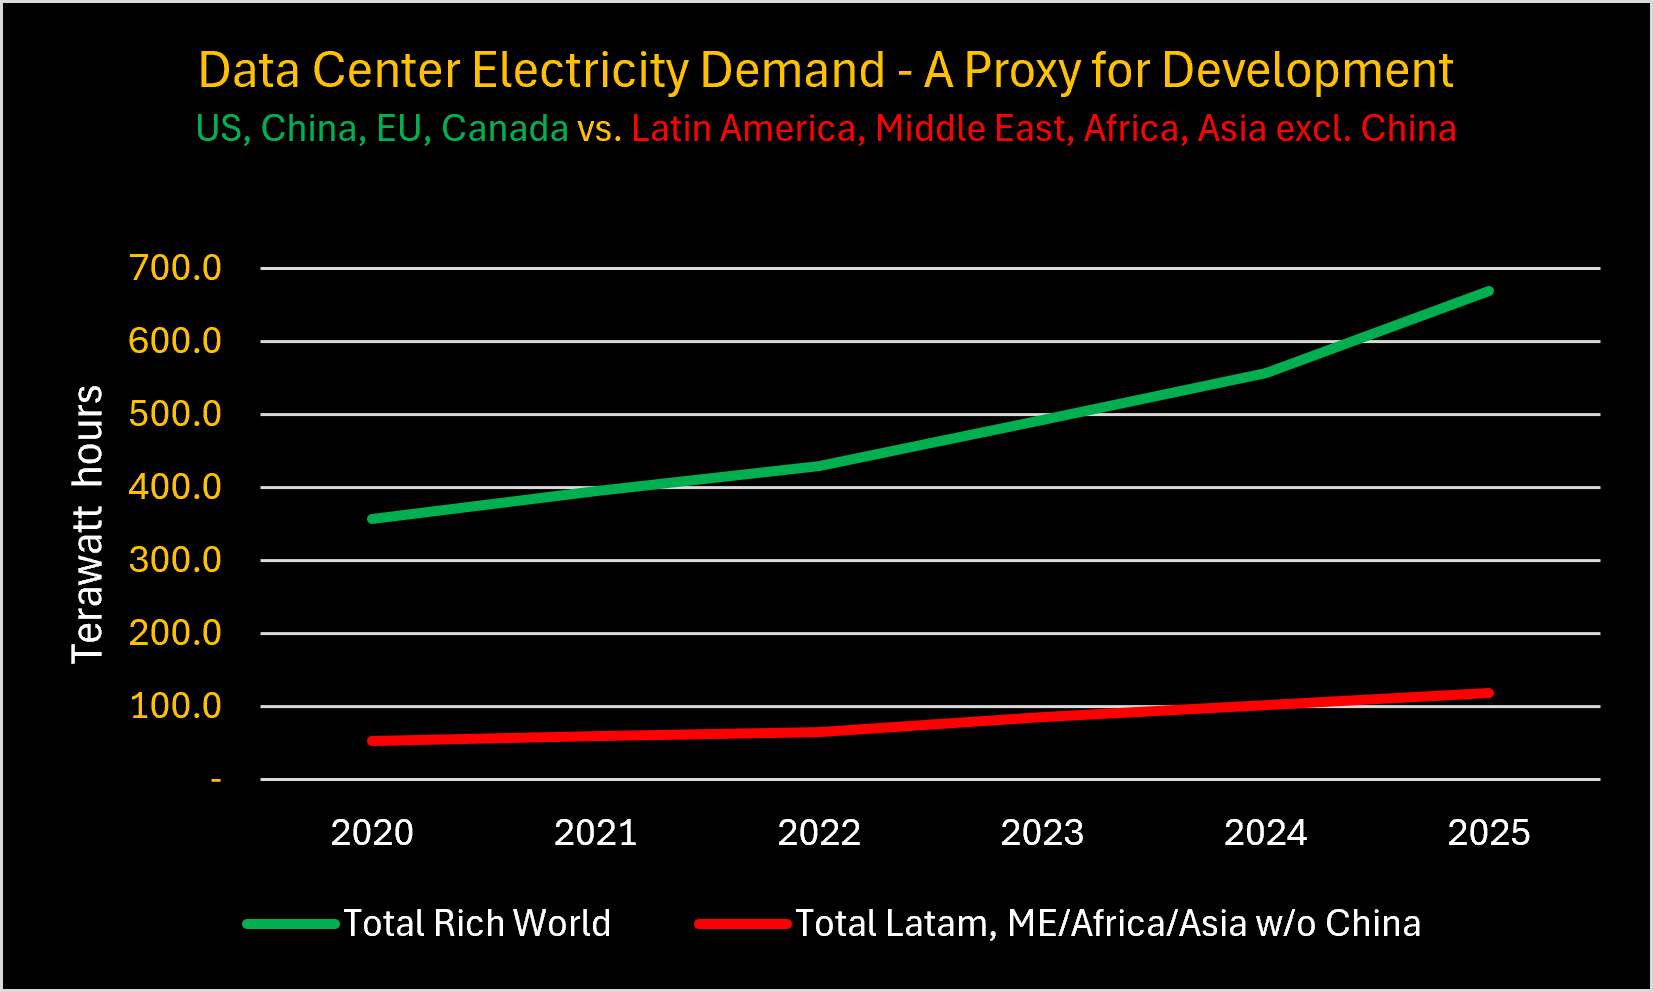
The 2026 Review figures on data center electricity consumption are another glaring example of the importance of energy to economic development in the twenty-first century. Data center electricity demand is a proxy for high tech 21st century economic development. The countries where it is lowest are not even in the same race being run between China and the U.S., while the EU and Canada hope to keep up.
We close by noting that despite the world consuming record amounts of hydrocarbon energy, the carbon intensity of the global economy continued its relentless decline in 2025. Some would like you to believe it is because of “climate policy”. It is not.
As we showed in The New Deniers, global carbon intensity has been declining steadily since ~1960. Even with the US burning more coal in 2025, it still decreased last year, in an amount very close to the long-term average decline.
As Roger Pielke, Jr. noted in a post this week, as a practical matter the world cannot “decarbonize” and get to “net zero” by 2050.
“Reaching zero by 2050 requires retiring ~21 exajoules of fossil energy every year, starting now. That annual reduction exceeds the total energy consumption of most countries on Earth. And every year the line fails to bend down, the required rate in the remaining years grows larger, just as a matter of math.
Replacing 21 EJ of fossil energy per year, and retiring an equal amount of fossil supply alongside it, means building the equivalent of about one 1.75-gigawatt nuclear plant every day from now until 2050 — roughly 420 plants a year. Measured in wind turbines instead, at 3 megawatts and a 0.30 capacity factor, that comes to about 2,000 turbines a day, every day, for 25 years.”
We’ll be blunter. The chances that anyone reading this post will live to see a an actual “net zero” world in their lifetime are Slim and None. And Slim left town on the 4:30 p.m. Greyhound to El Paso.
If you are reading this while holding a newborn baby, chances are very high that your child will not live long enough to see the world truly reach “net zero” CO2 and GHG emissions either. Purely as a practical matter given the required pace and extent of the reduction in fossil fuel use and replacement with zero carbon emission sources, eighty years would be a near miracle in our view.
Like it or not, hydrocarbons are still the Crown Joule of the world’s primary energy consumption. Whatever “transition” exists, it stands no chance of changing that reality any time soon.
(Editor’s Note: forgive us if we’re slower than normal responding to comments the next few days while we’re out west fly fishing.)
“Like” this post to send us good luck stalking Cutthroats in the Yellowstone ecosystem the next few days.
Leave us a comment. We read them all and reply to most. Refuels the tank here.
environMENTAL is a reader-supported publication. We are free to all but would appreciate your voluntary paid subscription as a show of support for our work. Subscribe below.
Share this post. Helps us grow. We’re grateful for the assist!
The green dreams remind me of the sign hanging in the bar at Up the Creek raw bar in Aplachicola FL. “Free Beer, Tomorrow”. It’s always going to be the savior, tomorrow. Reality is difficult to escape……. Just like physics. Good luck and enjoy the trip, the world will be here when you return 🙏🇺🇸
I like how you added "(reportedly)" when mentioning China's flat coal generation.
2025 was China's biggest annual coal power build-out in in over a decade ~78GW and it's growing larger. It's utterly unbelievable to me that their renewables displaced coal in actual generation or that they are building but not using this coal capacity. It undermines all of the stats coming out of China and thus the whole Review given how large China's share is.